
We wrote in detail about our Raspberry Pi geiger counter project in another post, now this guide focuses on the basics necessary to build your own. Read on to discover how to assemble a background radiation monitor with a web dashboard to show pretty graphs (who doesn’t like pretty graphs?!).
Introduction
We build and feature projects that monitor the environment around them quite frequently at balena, but this is the first time we’ve started to take a look at monitoring radiation levels.
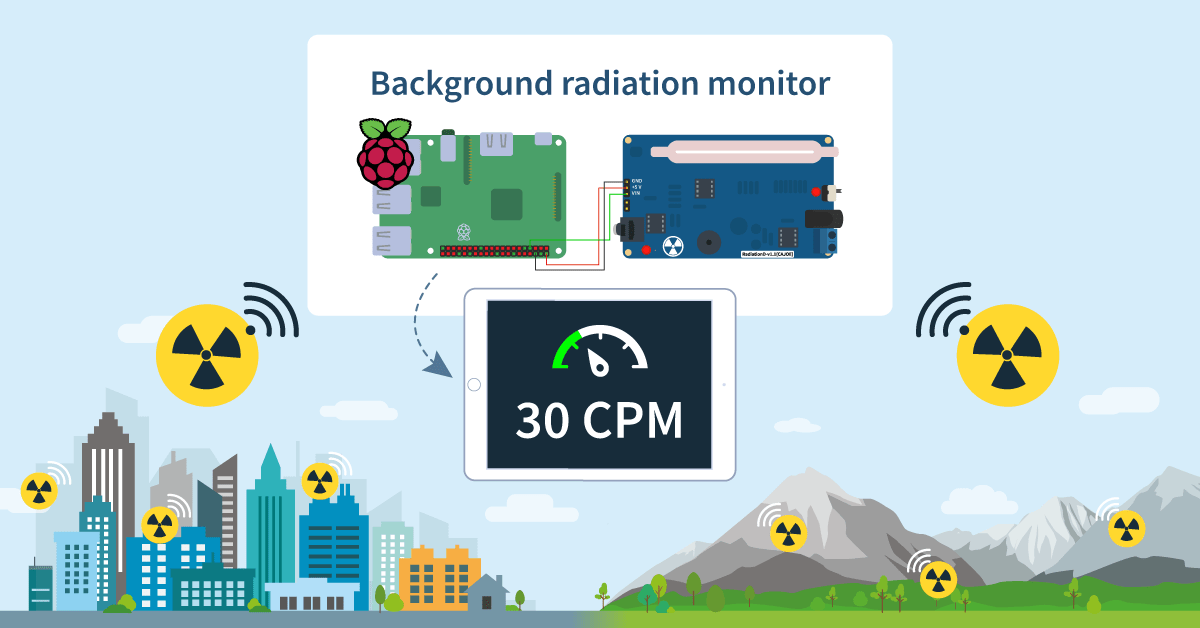
The process of gaining a reading for background radiation levels is not a simple one, but the reading itself is; it’s simply pulses that we can count, usually on a per minute basis, to give a count per minute, or CPM, reading. This can then be converted to other units by a multiplication factor based on the measurement device, if required.
To do this we need a radiation detector board, sometimes known as a Geiger counter or Geiger-Muller counter, named after those who invented it. In this project we’ve used the lowest cost board we could find readily available, but this could easily be upgraded to give more accurate readings. Let’s get to countin’!
Hardware required

Although in our build we used a lot of additional hardware to make a fancy box with some LED counters, the core of the project is simple and only needs a few basics:
- A Raspberry Pi (any model should be good for this, but I’d recommend a 3 or above just for performance reasons)
- An 8GB (or larger) SD card (we recommend SanDisk Extreme Pro SD cards)
- A power supply (PSU)
- A radiation detector Amazon UK or AliExpress
- Some Dupont cables/jumper jerky (you’ll need 3 female-female cables)
Connect it up
There are 3 connections we need to make from the radiation detector board to the Raspberry Pi. They are +5V and Ground (GND) for power, and the output pulse line to detect the count. Note that this is called VIN which can be a bit confusing as this usually means ‘voltage input’ or something similar, but on this board, it’s the output.

In this configuration you only need to provide 5 volt power to one of the two boards; if you’re powering the Pi with a standard micro-USB power supply, that will power the detector board via the connections we’ve just made, as well.
Set up the software
Step 1: Deploy with balena
We’ve made the software for this project available on GitHub, and deployable to a Rasberry Pi via balenaCloud using the button below:
We recommend this button as the de-facto method for deploying new apps on balenaCloud, but as an alternative, you can set this project up with the repo and balenaCLI if you choose. Get the code from GitHub, and set up balenaCLI on your computer to push the code to balenaCloud and your devices.
Step 2: Set up the Raspberry Pi
Select your device type, and click ‘Create and deploy’.

When you use Deploy with balena, your application name will default to the name of the repo. You can change this to what you want to use and it won’t affect this process.
At this point, balenaCloud is automatically copying all the software for the project from the GitHub repo to your application in the background. If you’re already familiar with balenaCloud you can also deploy the code with the CLI.

Next, add your device to the application by flashing your SD card. Within the application, select on the upper left corner ‘Add device’ being sure to select ‘Wifi + Ethernet’ to set up the wireless network. Enter your WiFi SSID and password – this injects the details into the downloaded OS so that the device will automatically link up to the WiFi when it starts up.

Once you download the OS image, use balenaEtcher to flash the image onto the SD card.

Once the flashing is completed, insert your SD card into the Pi and power it up. It will take a few minutes to show up on your balenaCloud account.
After the device appears online in the dashboard, it will start to download the application.
Check the output
Once your device is showing in the dashboard, you can view the details for that device and enable the public URL (shown below) to access the Grafana dashboard. Using the local IP address will work just fine too if you’re on the same local network.

As long as all the services are up and running as shown above, clicking on the public URL link should take you to the Grafana dashboard, which looks something like the below (after your counter has been running for a few hours).

Doing more
Now your counter is up and running, you could call it complete and start to build a historical dataset of the background radiation in your area. BUT WAIT! There’s more you can do!
If you had a look at our build log, you’ll see we added on some extra electronics for some LED counters. These are built entirely independently from the Raspberry Pi and can be a fun addition to the project to make it a bit more interesting.
Hardware required
To add two LED counters in a circular fashion like we did, you’ll need the following additional electronic components:
- 2x CD 4017 Decade counter chips (AliExpress, Ebay)
- 20x LEDs (your choice of colour and variant, I used 3mm orange) (Ebay – note this listing provides all the voltage ratings to use in the calculator below)
- 2x Resistors for your LEDs (here’s a handy resistor calculator to help you figure out what you need. The source voltage is 5V in this case). If you don’t have one already I’d recommend getting a resistor kit like this one to get a variety of values.
- Solderless breadboard, or prototyping board
- Connection wires
Unless you already have a preferred supplier, I recommend Ebay for obtaining small quantities of a wide variety of LEDs and other electronic components.
LED counter schematic
This is the schematic for the counter, the feed to the CLK input on the first counter comes from the VIN output of the radiation detector. Note that in this configuration where the output of the detector is connected to both the Raspberry Pi and your circuit simultaneously, the LED counter won’t work until the Pi has booted up and changed the mode of it’s GPIO pin to an input.

Success?
No matter if you had success or if you got stuck along the way, we’d like to hear from you! You can always find help in our support forums, and if you successfully got things up and running we like the Tweets, the Instas, and books of faces too.
In addition to that, if you have any ideas to make the project better or want to contribute in any way, the GitHub repo is the place to submit issues and PRs.
See you next time!

I would like to setup a permanent sensor outdoors. What material should be used to house the sensor/gm-tube?
Hello! I deployed, turned on public URL, and see the dashboard successfully. I can also hear the radiation detector ticking. But the CPM and Micro Sieverts per hour both show “no data.” The CPM and microS/h change values change periodically, and I set the graphs to show “last five minutes.” But they still show no data. Is there something else I should be turning on? Thank you all in advance!
Ah nevermind! It was just a matter of waiting a while!
Glad to read that it works @temko and BTW welcome to the balena community!