
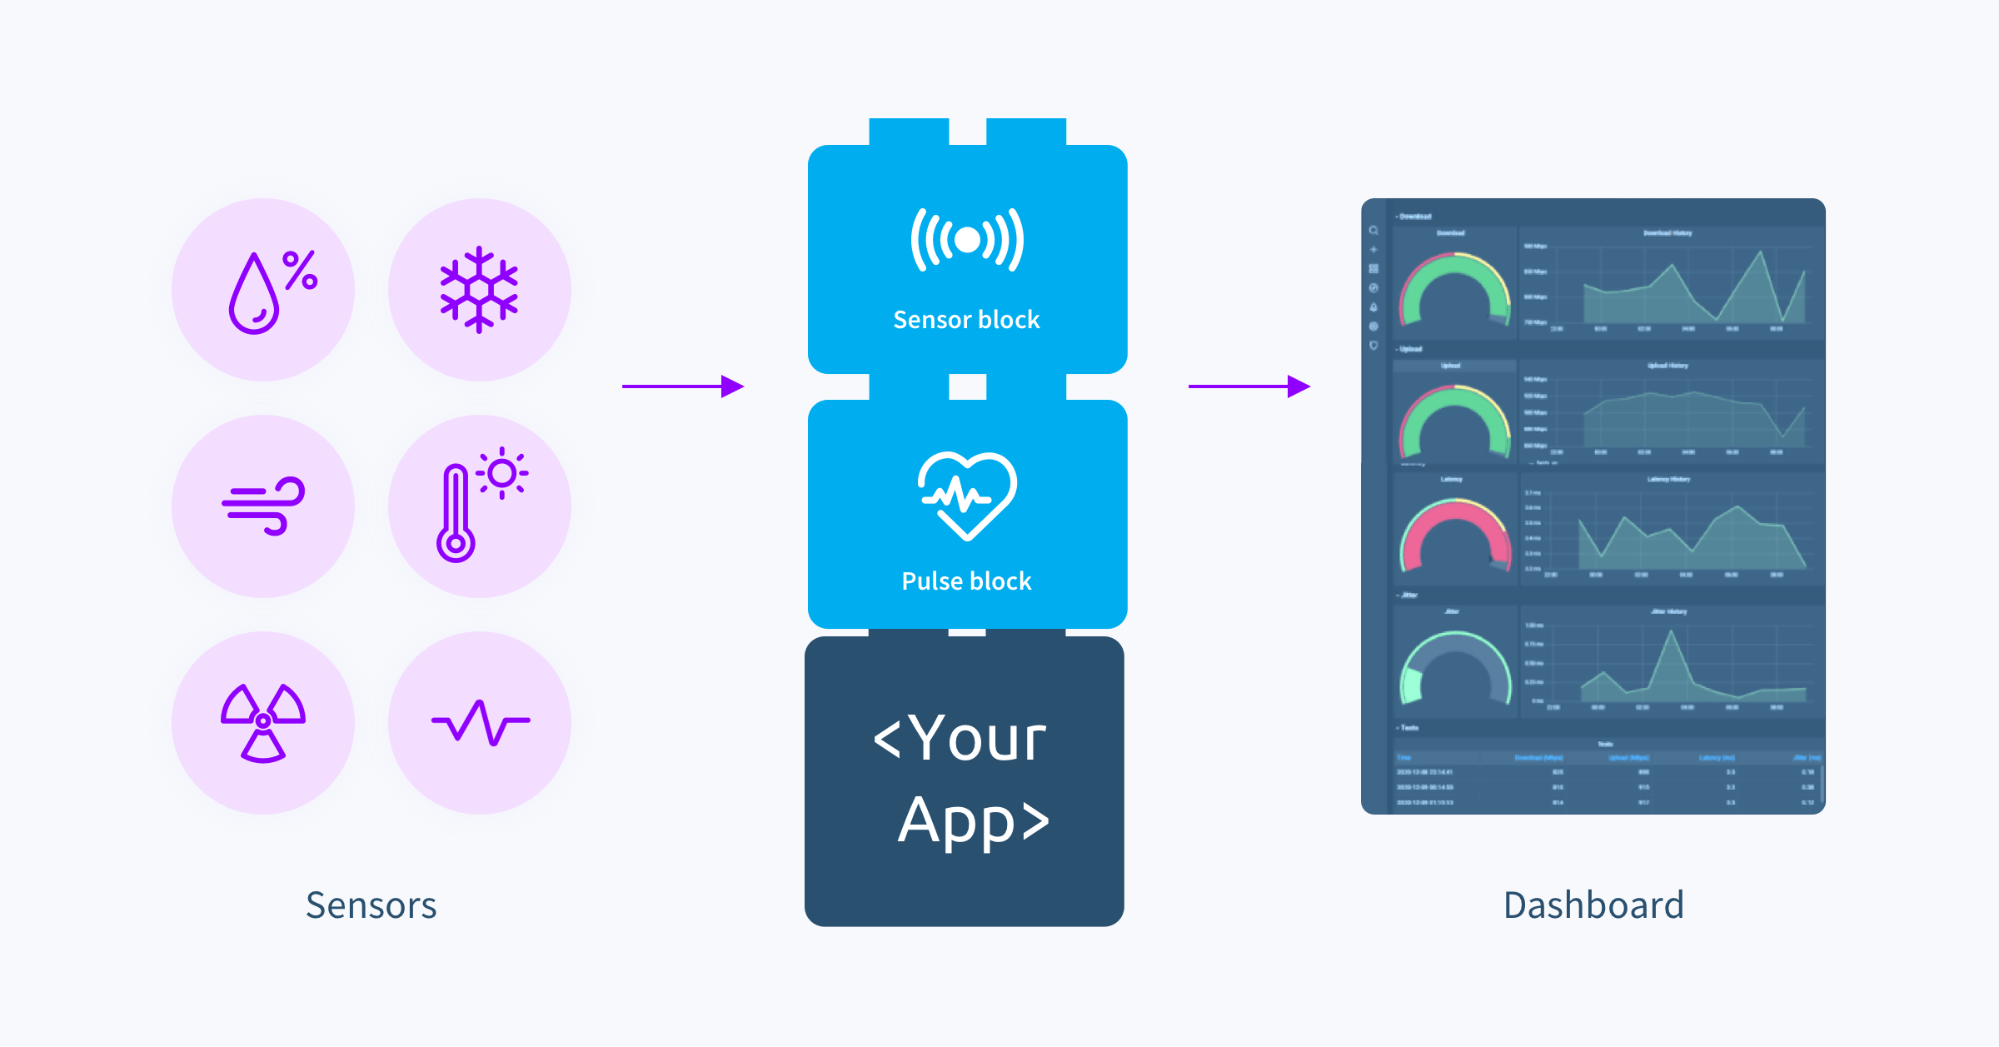
In this post, we introduce the sensor and pulse blocks, both designed to make it easy to bring data from sensors and other equipment into your projects. We’ll also look at the decisions made during the development of these blocks in order to keep their setup and usage simple, as well as a few example projects that utilize multiple blocks.
In a previous post we introduced balenaBlocks, which are intelligent, drop-in chunks of functionality built to handle common tasks, allowing you to focus on solving the hard IoT problems. Examples of these blocks include Browser, Audio, Dashboard and Connector. NOTE: It may be helpful to read the previous post before continuing on!
Background
In 2019, we introduced balenaSense, a great starter project that allows you to measure air quality using a sensor attached to a Raspberry Pi. It uses InfluxDB to store the sensor data, Grafana to display the data on a dashboard, and Telegraf to route the data between the two.
While balenaSense does an awesome job, the shell scripts and config files that hardwire all of these pieces together mean that the project has a single purpose. If you want to change how it works, you likely need to make changes in multiple places.

When we looked at the blocks we’ve introduced so far, we realized that we could replicate everything in balenaSense using blocks except for one piece: the custom code that takes the readings from a sensor and publishes it using http. With that in mind, we set out to fill that gap with a block which would allow any sensor data to be stored and displayed.
Designing the sensor block
To quote the general description of blocks from our earlier post:
“At their heart, blocks deploy one or more executables, run them on top of a balena base image, and wrap around them to make them easier to configure and manage. The wrapper should use the functions of the balena environment to discover and automatically configure the executable wherever possible, to intelligently offer an opinion on how the executable is likely to be used.”
First we needed to decide what executable would form the core of our block. We knew that we could simply adapt the Python code from balenaSense that reads the sensors, but we wanted something more generic. The ideal solution would improve on balenaSense and allow the use of more than one sensor at a time.
In addition, we wanted “plug and play” functionality so the user could add and remove sensors at will, relying on the block to detect the change automatically without the need for user intervention.
One colleague suggested that we look into the Industrial IO (IIO) system for the core of our block. IIO is a subsystem to ease the interfacing of sensors with Linux. It does this by including sensor drivers in the kernel itself, however most operating systems will only include a subset of these kernel drivers in order to save space. The list of IIO drivers included in balenaOS contained a number of popular sensors, making that a good starting point.
Now that we had decided on IIO as the core, we worked on the design of the block. This resulted in wrapping IIO in some code to: scan the I2C bus for connected sensors, load the appropriate drivers, and publish the data. In keeping with the opinionated nature of blocks, we defaulted to publishing the sensor data via an HTTP server on port 7575 so it could easily be used with the connector block. However blocks are also configurable, so we made it possible to specify an MQTT broker address, which causes the block to publish the data there.
Here’s a diagram of our completed block:

Using the sensor block
The first step is to see if your I2C sensor is supported. All of the IIO sensor drivers in balenaOS for the Raspberry Pi are listed below.
| Sensor Model | Sensor Name | Sensor Tested |
|---|---|---|
| AD5301 | Analog Devices AD5446 and similar single channel DACs driver, TI DACs | Not tested |
| APDS9960 | Avago APDS9960 gesture/RGB/ALS/proximity sensor | Yes, NOT working |
| BME680 | Bosch Sensortec BME680 sensor | Yes, works |
| BMP180 | Bosch Sensortec BMP180 sensor | Not tested |
| BMP280 | Bosch Sensortec BMP280 sensor | Yes, works |
| HDC1000 | TI HDC100x relative humidity and temperature sensor | Not tested |
| HTU21 | Measurement Specialties HTU21 humidity & temperature sensor | Yes, works |
| MS8607 | TE Connectivity PHT sensor | Yes, works partially (no pressure reading) |
| MCP342x | Microchip Technology MCP3421/2/3/4/5/6/7/8 ADC | Not tested |
| ADS1015 | Texas Instruments ADS1015 ADC | Yes, NOT working |
| TSL4531 | TAOS TSL4531 ambient light sensors | Not tested |
| VEML6070 | VEML6070 UV A light sensor | Yes, works |
In theory, this block should work on any device that has an I2C connection, and is only limited by the IIO sensor drivers included in the Host OS. To use on a device other than the Raspberry Pi, see the readme in the block’s repository for more information about detecting included drivers. Industrial users may want to investigate the balenaFin, a Raspberry Pi Compute Module carrier board that can run all the software that the Raspberry Pi can run, but hardened for deployment in the field.
Connect one or more compatible, working sensors from the list above to the I2C pins on your device. (We’ll continue looking into the sensors that are not working!) If using more than one sensor, make sure they do not share the same I2C address. This is typically a problem if you have more than one of the same sensor – many allow you to set an alternate address, check the datasheet or manual of your sensor for more information.
To use the block in your project, add the following lines to the services: section of your docker-compose.yml file:
sensor:

    image: balenablocks/sensor

    privileged: true

    labels:

      io.balena.features.kernel-modules: '1'

      io.balena.features.sysfs: '1'

      io.balena.features.supervisor-api: '1'

    expose:

      - '7575'  # Only needed if using the internal HTTP server
Once your container starts, it will immediately begin scanning for sensors and report on its progress in the terminal window. Once it has found a sensor, it will display an initial reading.
The sensor data is available in JSON format either as an MQTT payload and/or via the built-in HTTP server. To use MQTT, provide a broker address for the MQTT_ADDRESS service variable. If no MQTT address is set, the HTTP server will be available on port 7575. To force the HTTP server to be active even with MQTT, set the ALWAYS_USE_HTTPSERVER service variable to 1.
To test the data from the sensor block, you could issue the command curl sensor:7575 from another container in your project, or curl 192.168.1.150:7575 from another computer on your network. (Replace 192.168.1.150 with the IP address of your device!) An example response with two sensors connected is displayed below:
[{'measurement': 'htu21', 'fields': {'humidityrelative': '29700', 'temp': '23356'}}, {'measurement': 'bmp280', 'fields': {'pressure': '99.911941406', 'temp': '23710'}}]
If you want all of the fields in a single list, you can set the COLLAPSE_FIELDS service variable to 1 and the output will look like the following:
{'humidityrelative': '29700', 'temp': '23356', 'pressure': '99.911941406'}
Note that if two sensors output the same field name, it will only show up once in the list from one of the sensors. Collapsing fields is best done when the field names from sensors do not overlap.
The above examples display the raw data from the sensor as exposed by the driver, which is the default setting for the block. In many cases, the values and names need transformations to be useful. You can change the RAW_VALUES service variable from the default value of 1 to 0 (zero) to output transformed data instead. All the transformations are defined per-sensor in the transformations.py file which you can edit to your needs. We’ve included some basic ones for you. For example, here is the raw output of a bme680:
{"humidityrelative": 35.524, "pressure": 1005.48, "resistance": 52046.0, "temp": 24620.0}
Here is the transformed output with RAW_VALUES set to 0:
{"pressure": 1005.4, "resistance": 65454.0, "humidity": 35.541, "temperature": 24.54}
Note that in addition to standardizing the field names, it also moves the decimal place to the proper location for large values. When using transformed data outputs, you can change the temperature field from Celsius to Farenheit by setting the TEMP_UNIT variable to F (the default is C)
Revisiting balenaSense
Looking back at the original impetus for the sensor block, we wanted to be able to replicate the functionality of balenaSense using only blocks. Now that we have the sensor block, it is possible to build a project that closely approximates balenaSense with the following docker-compose file and nothing else:
“`
version: ‘2’
volumes:
sense-data:
dashboard-data:
services:
influxdb:
restart: always
image: arm32v7/influxdb:latest
volumes:
– ‘sense-data:/data’
dashboard:
image: balenablocks/dashboard
restart: always
volumes:
– ‘dashboard-data:/data’
ports:
– ’80’
sensor:
image: balenablocks/sensor
privileged: true
labels:
io.balena.features.kernel-modules: ‘1’
io.balena.features.sysfs: ‘1’
io.balena.features.supervisor-api: ‘1’
expose:
– ‘7575’
connector:
image: balenablocks/connector:raspberrypi3
restart: always
labels:
io.balena.features.balena-api: ‘1’
privileged: true
“`
Simply save this file as docker-compose.yml, create a new application in balenaCloud, and balena push this to the new application. Learn more about building and editing your docker-compose file on our docs.
Once the build is complete, browse to the device’s public URL (or IP address locally) and your sensors should already be populating data on an auto-generated dashboard.

To see the simplicity of our new sensor dashboard system, compare its diagram to our earlier diagram of balenaSense:

(In fact, balenaSense will migrate to using these blocks in the near future!)
The pulse block
Some sensors, such as water flow, speedometers, and optical meters don’t require any drivers at all and simply output pulses in the form of a square wave:

With this type of signal, we are usually interested in counting the total number of pulses or the number of pulses in a specific time period, such as every hour. The pulse block provides total pulse count, pulses per minute, second, and hour, as well as pulses multiplied by a specified factor, in a JSON format.
The pulse data is available in JSON format either as an MQTT payload and/or via the built-in HTTP server. To use MQTT, provide a broker address for the MQTT_ADDRESS service variable. If no MQTT address is set, the HTTP server will be available on port 7575. To force the HTTP server to be active even with MQTT, set the ALWAYS_USE_HTTPSERVER service variable to 1.
Although the block is most accurate when counting pulses from electronic sensors that output a pulse width modulation (PWM) signal, you can also simply attach a momentary switch to the GPIO pins and count the number of times or frequency the switch is pushed. This could, for instance, be used to detect events in mechanical equipment using microswitches.
The default GPIO pin for measuring pulses is board pin 37, also known as GPIO 26. You can change this to another pin by setting the GPIO_PIN service variable to a different board number. Depending on the type of sensor, you may also want to invoke the GPIO pin’s internal resistor with the PULL_UP_DOWN service variable. By default, this value is set to FLOAT which means no resistor is enabled. That’s a good setting for sensors that output continuous pulses. When using a mechanical switch, set the value to UP if your switch is connected to ground, or DOWN if your switch is connected to 3 volts.

A common problem with mechanical switches is that they tend to be electrically “noisy,” often generating unwanted pulses with each contact. One method for eliminating these unwanted pulses is called “debouncing.”
This block includes rudimentary software debouncing that should be sufficient for mechanically-generated pulses that are less (slower) than three pulses per second (3 Hz). This is accomplished by delaying the pulse count for a specified number of milliseconds (1000th of a second) after the rising edge of a pulse is detected. A good starting value is 75 milliseconds, and then slowly increasing the value by 50 until you find one that works. You may not find a value that avoids miscounting pulses in which case you may need to figure out why your switch is so noisy and improve it somehow. To define the debounce time, set the BOUNCE_TIME service variable. Setting the value to 0 or deleting it removes any debouncing.
Usage and example
To use the pulse block in your project, add the following lines to the services: section of your docker-compose.yml file:
“`
version: ‘2’
services:
pulse:
image: balenablocks/pulse
restart: always
privileged: true
expose:
– ‘7575’
“`
Note that the container must be privileged in order to access the GPIO pins.
Just as we reimagined balenaSense using the sensor block, let’s see how we can implement another past project using the pulse block. Last year we published a guide for building a background radiation monitor using a geiger counter connected to a Raspberry Pi.

The geiger counter outputs a PWM signal on its vin pin, so connect that to pin 37 on the Raspberry Pi (the diagram above shows it connected to pin 7, which you could do by setting the service variable GPIO_PIN) along with the +5v and ground pins as shown above.
All we need to do now is save the following as a docker-compose.yml file, create a new application in balenaCloud, and balena push this to the new application.
“`
version: ‘2’
volumes:
sense-data:
dashboard-data:
services:
influxdb:
restart: always
image: arm32v7/influxdb:latest
volumes:
– ‘sense-data:/data’
dashboard:
image: balenablocks/dashboard
restart: always
volumes:
– ‘dashboard-data:/data’
ports:
– ’80’
pulse:
image: balenablocks/pulse
restart: always
privileged: true
expose:
– ‘7575’
connector:
image: balenablocks/connector:raspberrypi3
restart: always
labels:
io.balena.features.balena-api: ‘1’
privileged: true
“`
Note how similar this file is to the one for balenaSense above. We’ve merely replaced the sensor block with the pulse block, and now we are graphing radiation data in our dashboard. Because they both publish JSON data via HTTP on port 7575, and the connector block looks for data on that port, we did not have to update any config files or tweak any code. It just works!
Pulse Data
Here’s an example of data output from the pulse block:
{"uuid": "a74be18a3fdc0b3bfb510e2cf84d6008", "gpio": 37, "pulse_per_second": 3, "pulse_per_minute": 180, "pulse_per_hour": 3145, "pulse_count": 3150, "pps_mult": 3, "ppm_mult": 180, "pph_mult": 3145}
The pulse_count is a running total of all pulses received. You can reset this value to zero by connecting a momentary switch between +3v and pin 38. The fields ending in _mult are the result of multiplying the similarly named fields without _mult by a specified value. You can set this value using the PULSE_MULTIPLIER service variable.
For example, with our geiger counter above, we can calculate micro-Sievert/hour (uSv/hr) by multiplying the pulse_per_minute by a factor of 0.00812037037037 (This value is specific to the type of tube used in your detector, in our example is is for a J305 type) If we set the PULSE_MULTIPLIER to this value, the ppm_mult value will now be equal to uSV/hr.

If you’d like to bundle the pulse or sensor block along with a simple LED display, check out our led-sensor-display project.
Overview
In this post we looked at two blocks that were designed to fill a functionality void in one or more of our projects. They were developed for interoperability with existing blocks, and to have some level of auto discovery. Their default settings make sense for most use cases, but can be overridden with service variables as needed. Additional service variables allow our blocks to be versatile, for example going from being a geiger counter to a speedometer by changing a single setting.
What should we “blockify” next?
What void do you see in your projects that could be answered with a block? Use our design process outlined above as a template and design your own! All of our blocks are open source so you can view their code for inspiration. Once your block is complete, you can easily submit it to our balenaHub a collection of edge and IoT projects created by fleet owners and product builders. We can’t wait to see what you come up with!
Check out our demo of the sensor and pulse blocks on the balena IoT Happy Hour #47.